


Click on a roof to visualise a summary of wind energy potential analysis for the selected wind turbine.
In 2022 the carbon intensity of Belgium’s power sector stood at 145 grams of carbon dioxide per kilowatt-hour (gCO₂/kWh) of electricity generated [1].
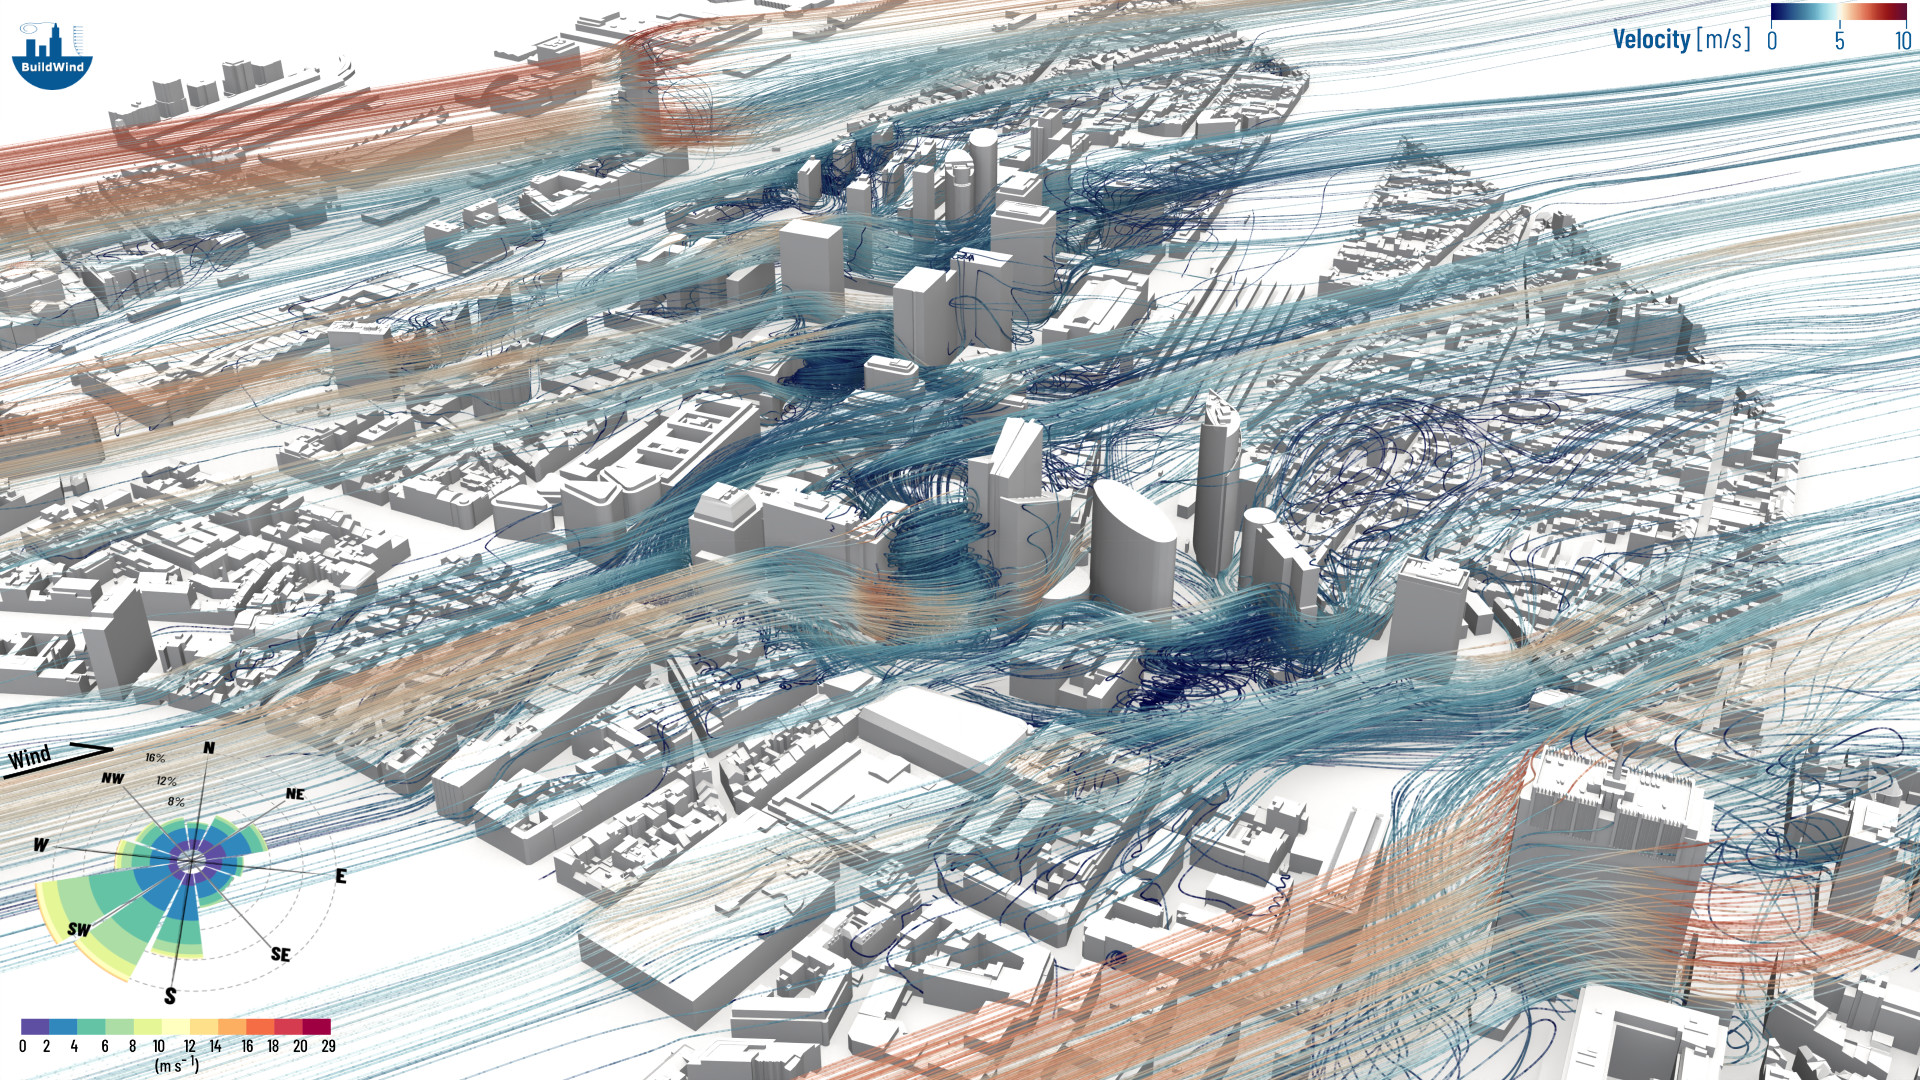
Northern Quarter, Brussels. Computational Fluid Dynamics simulation of wind blowing from the main wind direction.
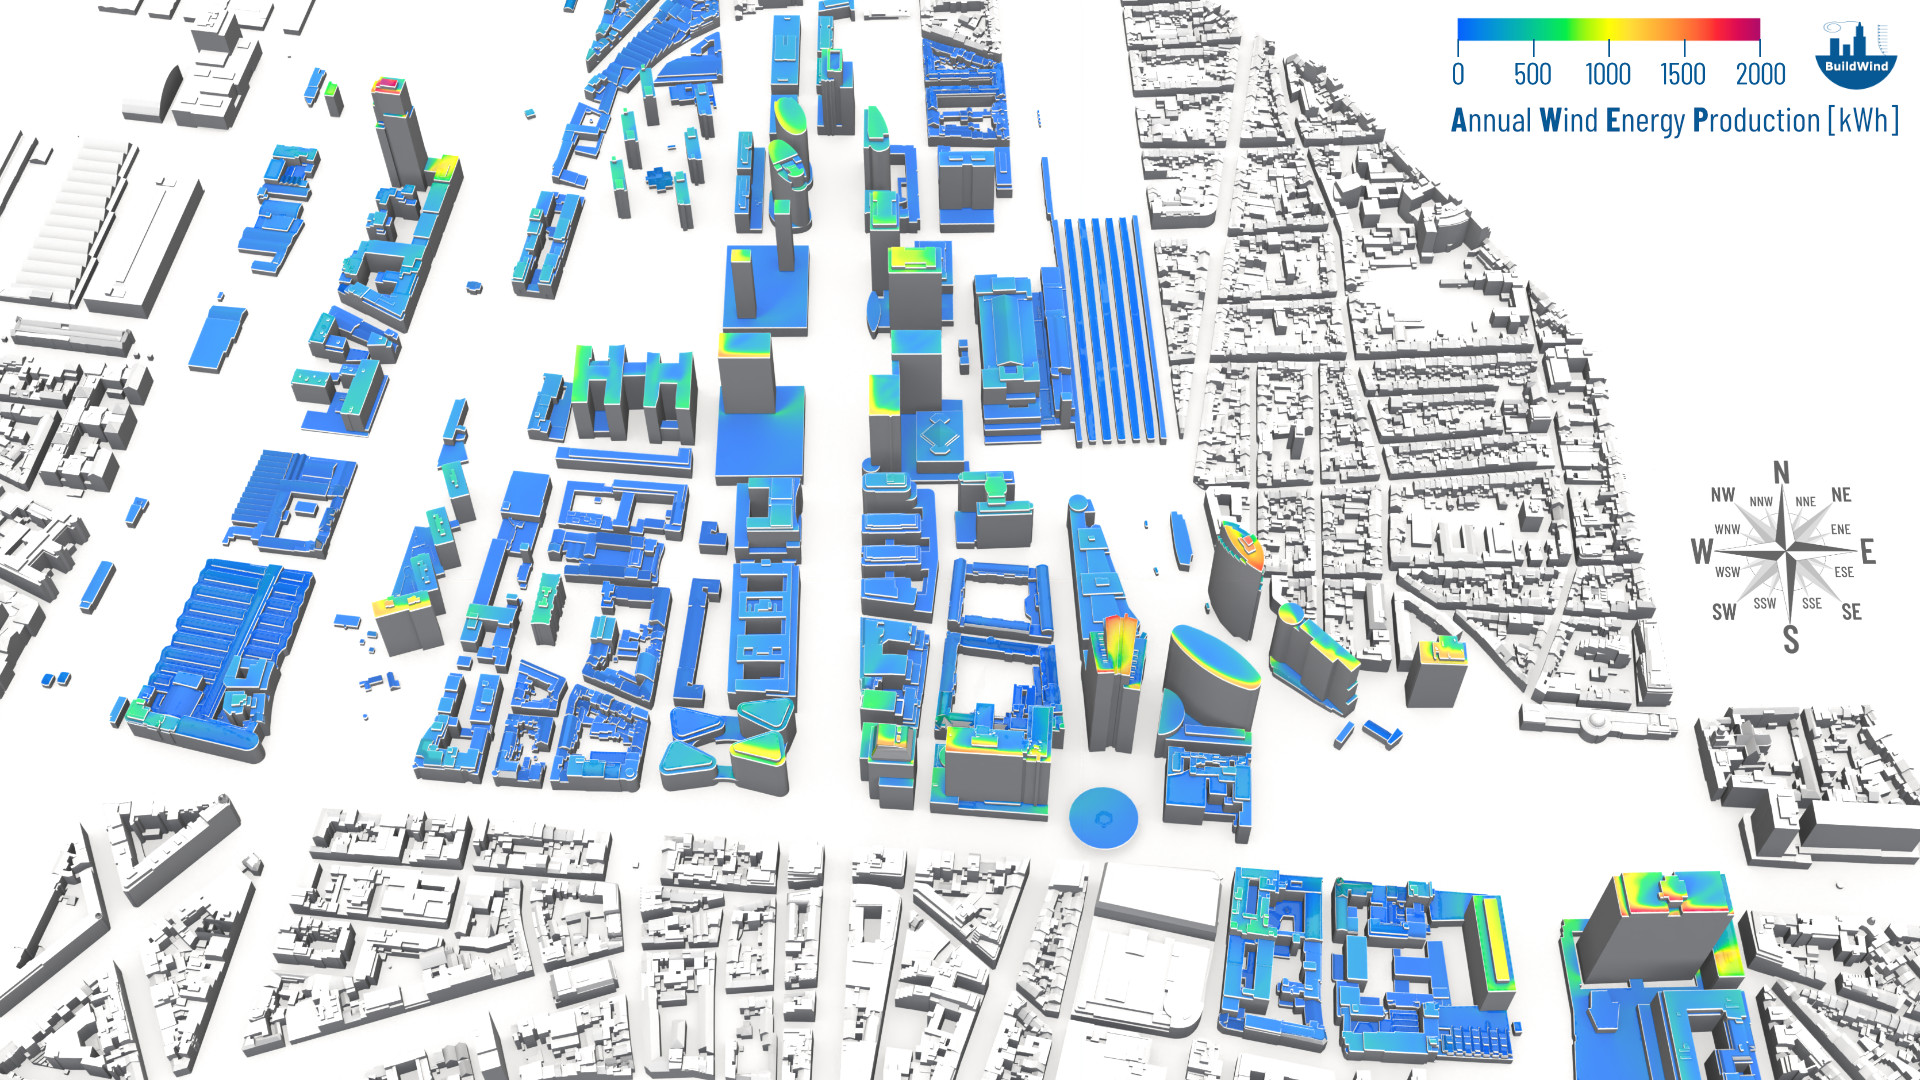
Northern Quarter, Brussels. Wind energy potential analysis on rooftops for a 1.5 kW vertical axis wind turbine based on Computational Fluid Dynamics simulations.
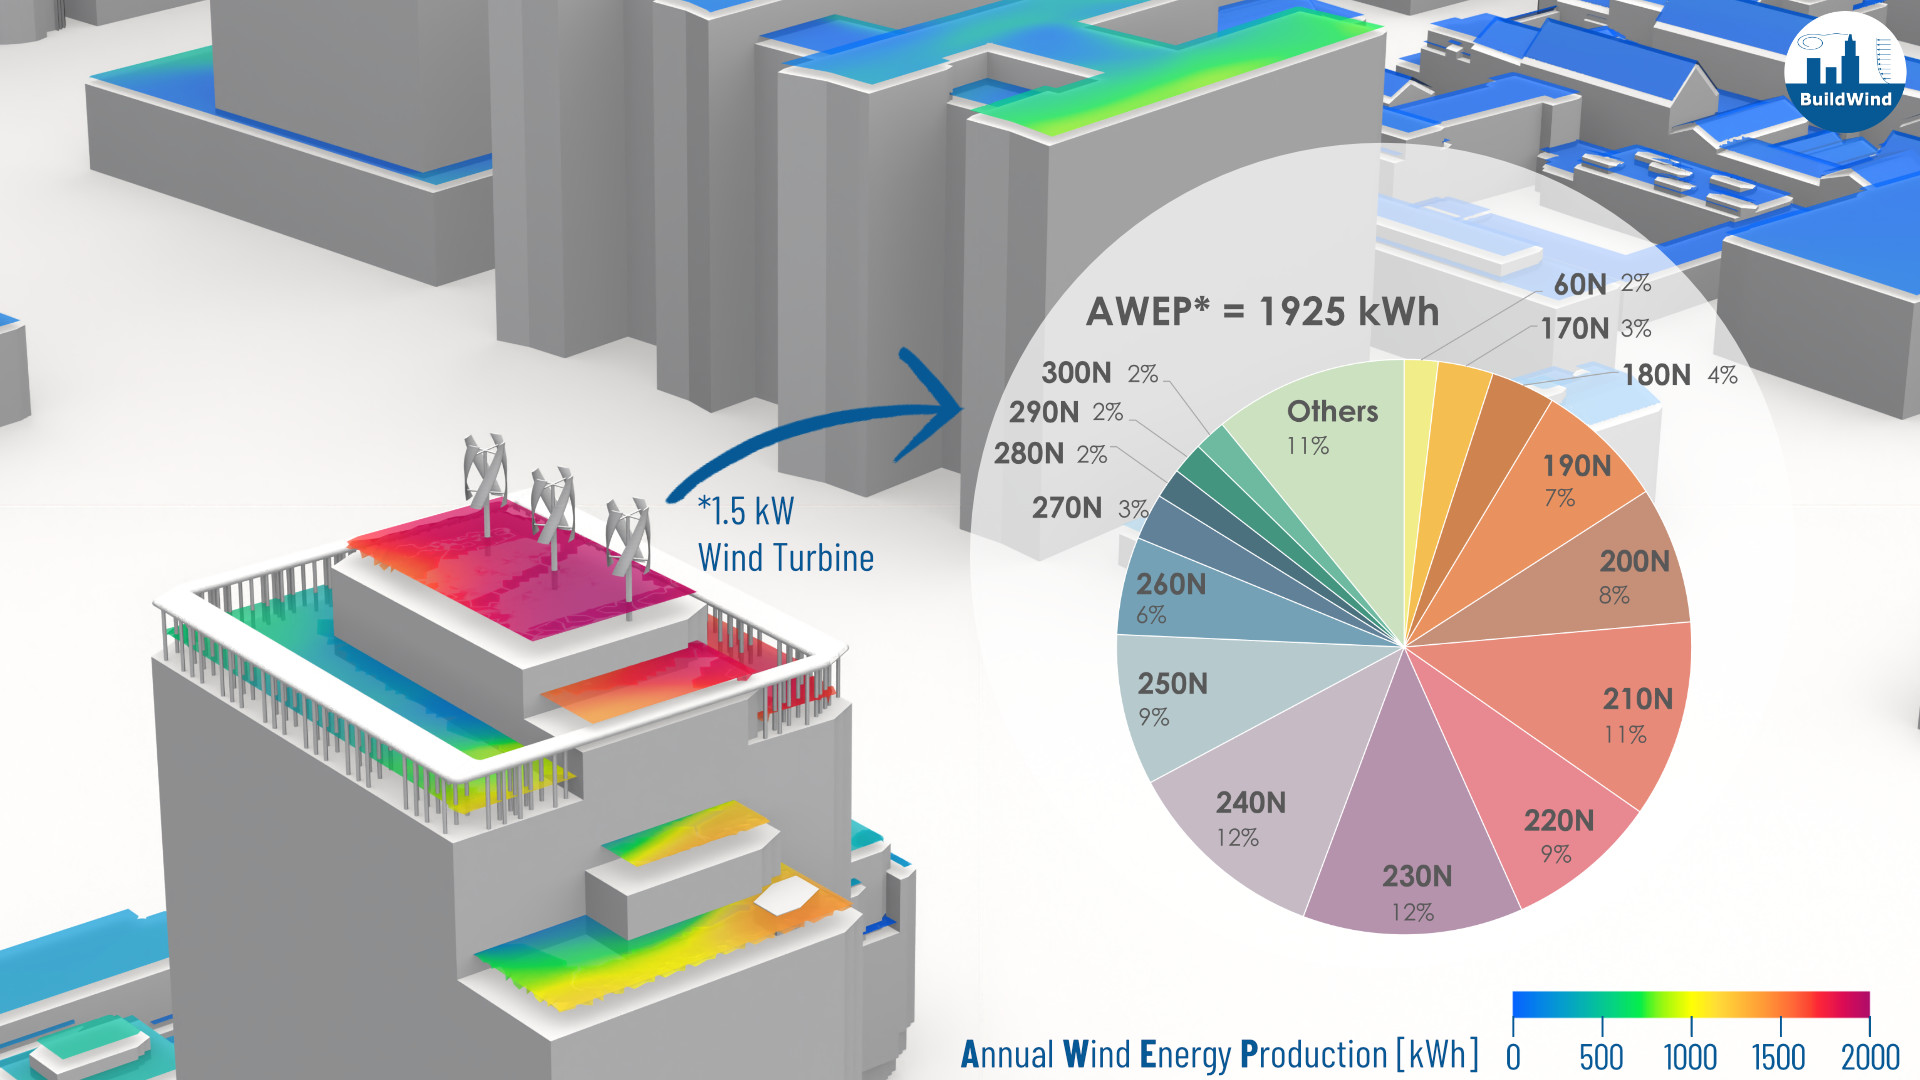
Northern Quarter, Brussels. Wind energy potential analysis and contribution given by each wind direction on a selected rooftop for a 1.5 kW vertical axis wind turbine. Analysis is based on Computational Fluid Dynamics simulations.
[1]. Greenhouse gas emission intensity of electricity generation in Europe, European Environment Agency. October 23rd, 2023
[2]. Raghunathan Srikumar, S., Cotteleer, L., Mosca, G., Gambale, A., Parente, A., Application of a comprehensive atmospheric boundary layer model to a realistic urban-scale wind simulation. Building and Environment. 2024, February 22: 111330.
[3]. Gambale, A., Raghunathan Srikumar, S., Mosca, G., Tsionas, I., Llaguno-Munitxa, M., Stephan, A., A data-driven surrogate model framework based on CFD simulations to accelerate wind energy yield assessment. ICWE 16, Florence, Italy. 2023, August 27-31.
[4]. Srikumar, S.K.R., Mosca, G., Tsionas, I., Llaguno-Munitxa, M., Stephan, A. and Gambale, A., A Computational Fluid Dynamics based framework to assess the wind energy potential of an urban landscape: A case study in Brussels. No. EGU23-15617. Copernicus Meetings. 2023, April 23-28.
[5]. Bellegoni, M., Cotteleer, L., Srikumar, S.K.R., Mosca, G., Gambale, A., Tognotti, L., Galletti, C. and Parente, A., An extended SST k−ω framework for the RANS simulation of the neutral Atmospheric Boundary Layer. Environmental Modelling & Software, 160, p.105583. 2023, February.
BuildWind headquarters in Brussels. Our office is walking distance from the city main train station (Gare du Midi), easily reachable by public transportation and by car.
BuildWind in London.

Company registration number: 0687-548-074
VAT number: BE 0687-548-074
Bank account | IBAN: BE70 3630 8093 5325
Bank account | BIC: BBRUBEBB